In addition, 19 qualitative metrics were collected and can be used for detailed analysis and issuing recommendations for individual airports.
The examples of these metrics include:
Reporting standard(s)/framework(s) used
External ESG ratings, awards, recognition
Action on climate change
Health and Safety statistics
… and others
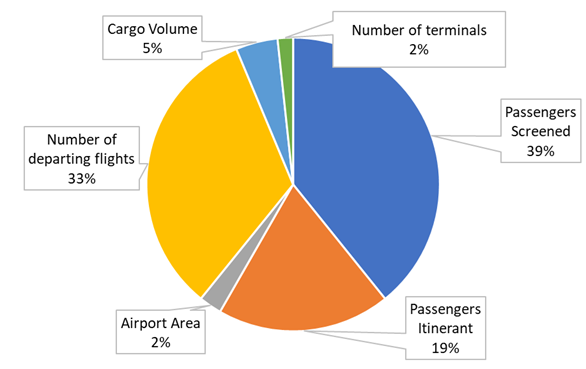
Contribution to Performance
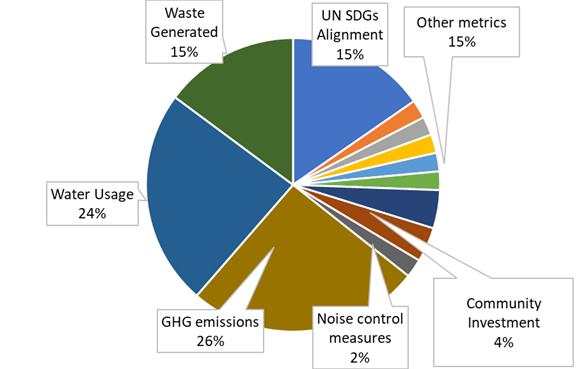
Contribution to ESG
Different metrics have different weights. The weights are estimated using pairwise comparison between metrics
The results are controlled using contribution to performance and ESG. Contribution is calculated by multiplying weight on average value for all airports.
The weights can be adjusted in the process of judgement elicitation from the experts in participating airports
Some public data for the parks could be inaccurate, inconsistent, or incomplete. Therefore, the following process was used to ensure the quality of the data:
Each data point was checked against multiple sources where possible.
The statistical distributions for each metric for all parks were generated. The outliers were then identified and each of them was validated. Any data deemed to be low quality was replaced by data from other sources or removed from the analysis.
Scores were calculated and “reality checks” were performed. The reality check would determine if the park was ranked approximately correctly based on assessed parameters. For example, a park with a large investment and large area should be ranked high on those metrics.
By browsing this website, you agree to our privacy policy.